


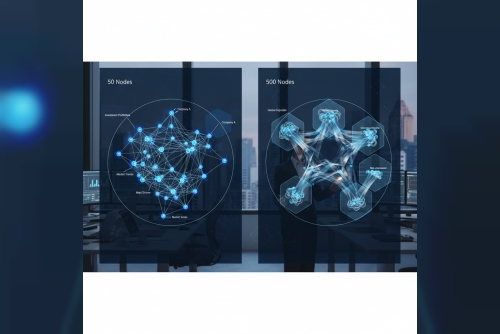
Press enter or click to view image in full siIn the world of financial fraud detection, speed and clarity are everything. The ability to recognize suspicious patterns before they escalate can mean the difference between preventing losses and becoming a target. However, as data volumes grow, visualizing interconnected financial networks, from just 50 nodes to 500 or more, becomes increasingly difficult. Analysts often face what’s known as the “spaghetti visualization” problem, where dense webs of connections turn insights into confusion.The Balancing Act: Clarity vs. Complexity
For financial institutions, the challenge lies in keeping visualizations clear as complexity rises. With smaller datasets, such as those involving 50 nodes, patterns are typically easy to interpret. But as networks scale to hundreds of nodes, analysts encounter several key issues:
Overlapping Connections: Dense visuals can obscure vital relationships.Signal Dilution: Genuine fraud indicators may get buried under unrelated connections.Analyst Fatigue: Overly complex visuals increase cognitive load, slowing down analysis and decision-making.RaptorX’s Solution: Human-Centered Graph IntelligenceRaptorX tackles these visualization challenges through a blend of real-time graph analytics and design built around human usability. The platform ensures that even as datasets grow, clarity and interpretability remain intact.
1. Adaptive Graph LayoutsRaptorX automatically adjusts layouts based on node density. Whether analyzing 50 or 500 nodes, the visualization dynamically optimizes itself, keeping relationships clear and important connections front and center.
2. Hierarchical ClusteringBy grouping related nodes into clusters, RaptorX allows analysts to prioritize what matters most. Suspicious clusters can be expanded for deeper investigation, helping analysts focus on high-risk activity while reducing visual noise.
3. Progressive DisclosureTo avoid information overload, RaptorX presents insights gradually. Analysts see key fraud patterns first, with additional details revealed as they explore deeper layers of the network. This stepwise approach keeps attention focused on the most relevant data.
4. Interactive Filters and Contextual InsightsWith intuitive filters, analysts can refine their view by transaction type, behavior, or risk score. Contextual tooltips further enhance understanding by offering real-time insights into relationships, so analysts never have to interpret dense graphs in isolation.
5. Real-Time Visualization UpdatesFraud patterns evolve quickly, and RaptorX keeps pace. The platform continuously updates visualizations as new transactions occur, ensuring analysts always work with the most current and accurate data.
Infrastructure That Scales SeamlesslyBehind every clear visualization lies a powerful backend. RaptorX’s infrastructure is engineered to handle vast, evolving datasets without performance loss.
Distributed Graph Processing: Ensures efficiency across large-scale data.Optimized Graph Databases: Enables rapid retrieval of relevant connections.Load Balancing and Caching: Keeps performance stable during peak analytical workloads.Why Analyst-Centric Design Makes the DifferenceAt RaptorX, visualization isn’t just about presenting data. it’s about empowering action. Every element, from clustering to interactivity, is designed to support the way analysts think and work. By combining scalability with human-centered design, RaptorX helps analysts detect mule rings, synthetic identities, and coordinated fraud patterns faster and with greater accuracy.
ConclusionVisualizing financial networks , whether 50 or 500 nodes, requires more than advanced technology; it demands thoughtful design that prevents visual overload. RaptorX achieves this balance by integrating adaptive layouts, intelligent clustering, and scalable infrastructure. The result is clarity without compromise, turning complex fraud networks into actionable insights that drive faster, more confident decisions.